Natural rubber content GWAS
GLM and MLM associations, model diagnostics and audited downloads.
GLM: PC1–PC3; MLM: PC1–PC3 and a standardized genomic relationship matrix. Interpretation is limited to this F1 family.
Genome-wide results for the selected model

Red dashed line: fixed exploratory screening at −log10(P)=4 (P≤1×10⁻⁴); gray dotted line: suggestive 1/M. Variants and candidate genes use the fixed cutoff; no empirical permutation calibration was performed.
View P≤1e-4 variants · View original Bonferroni reference plot
QQ plot and model statistics
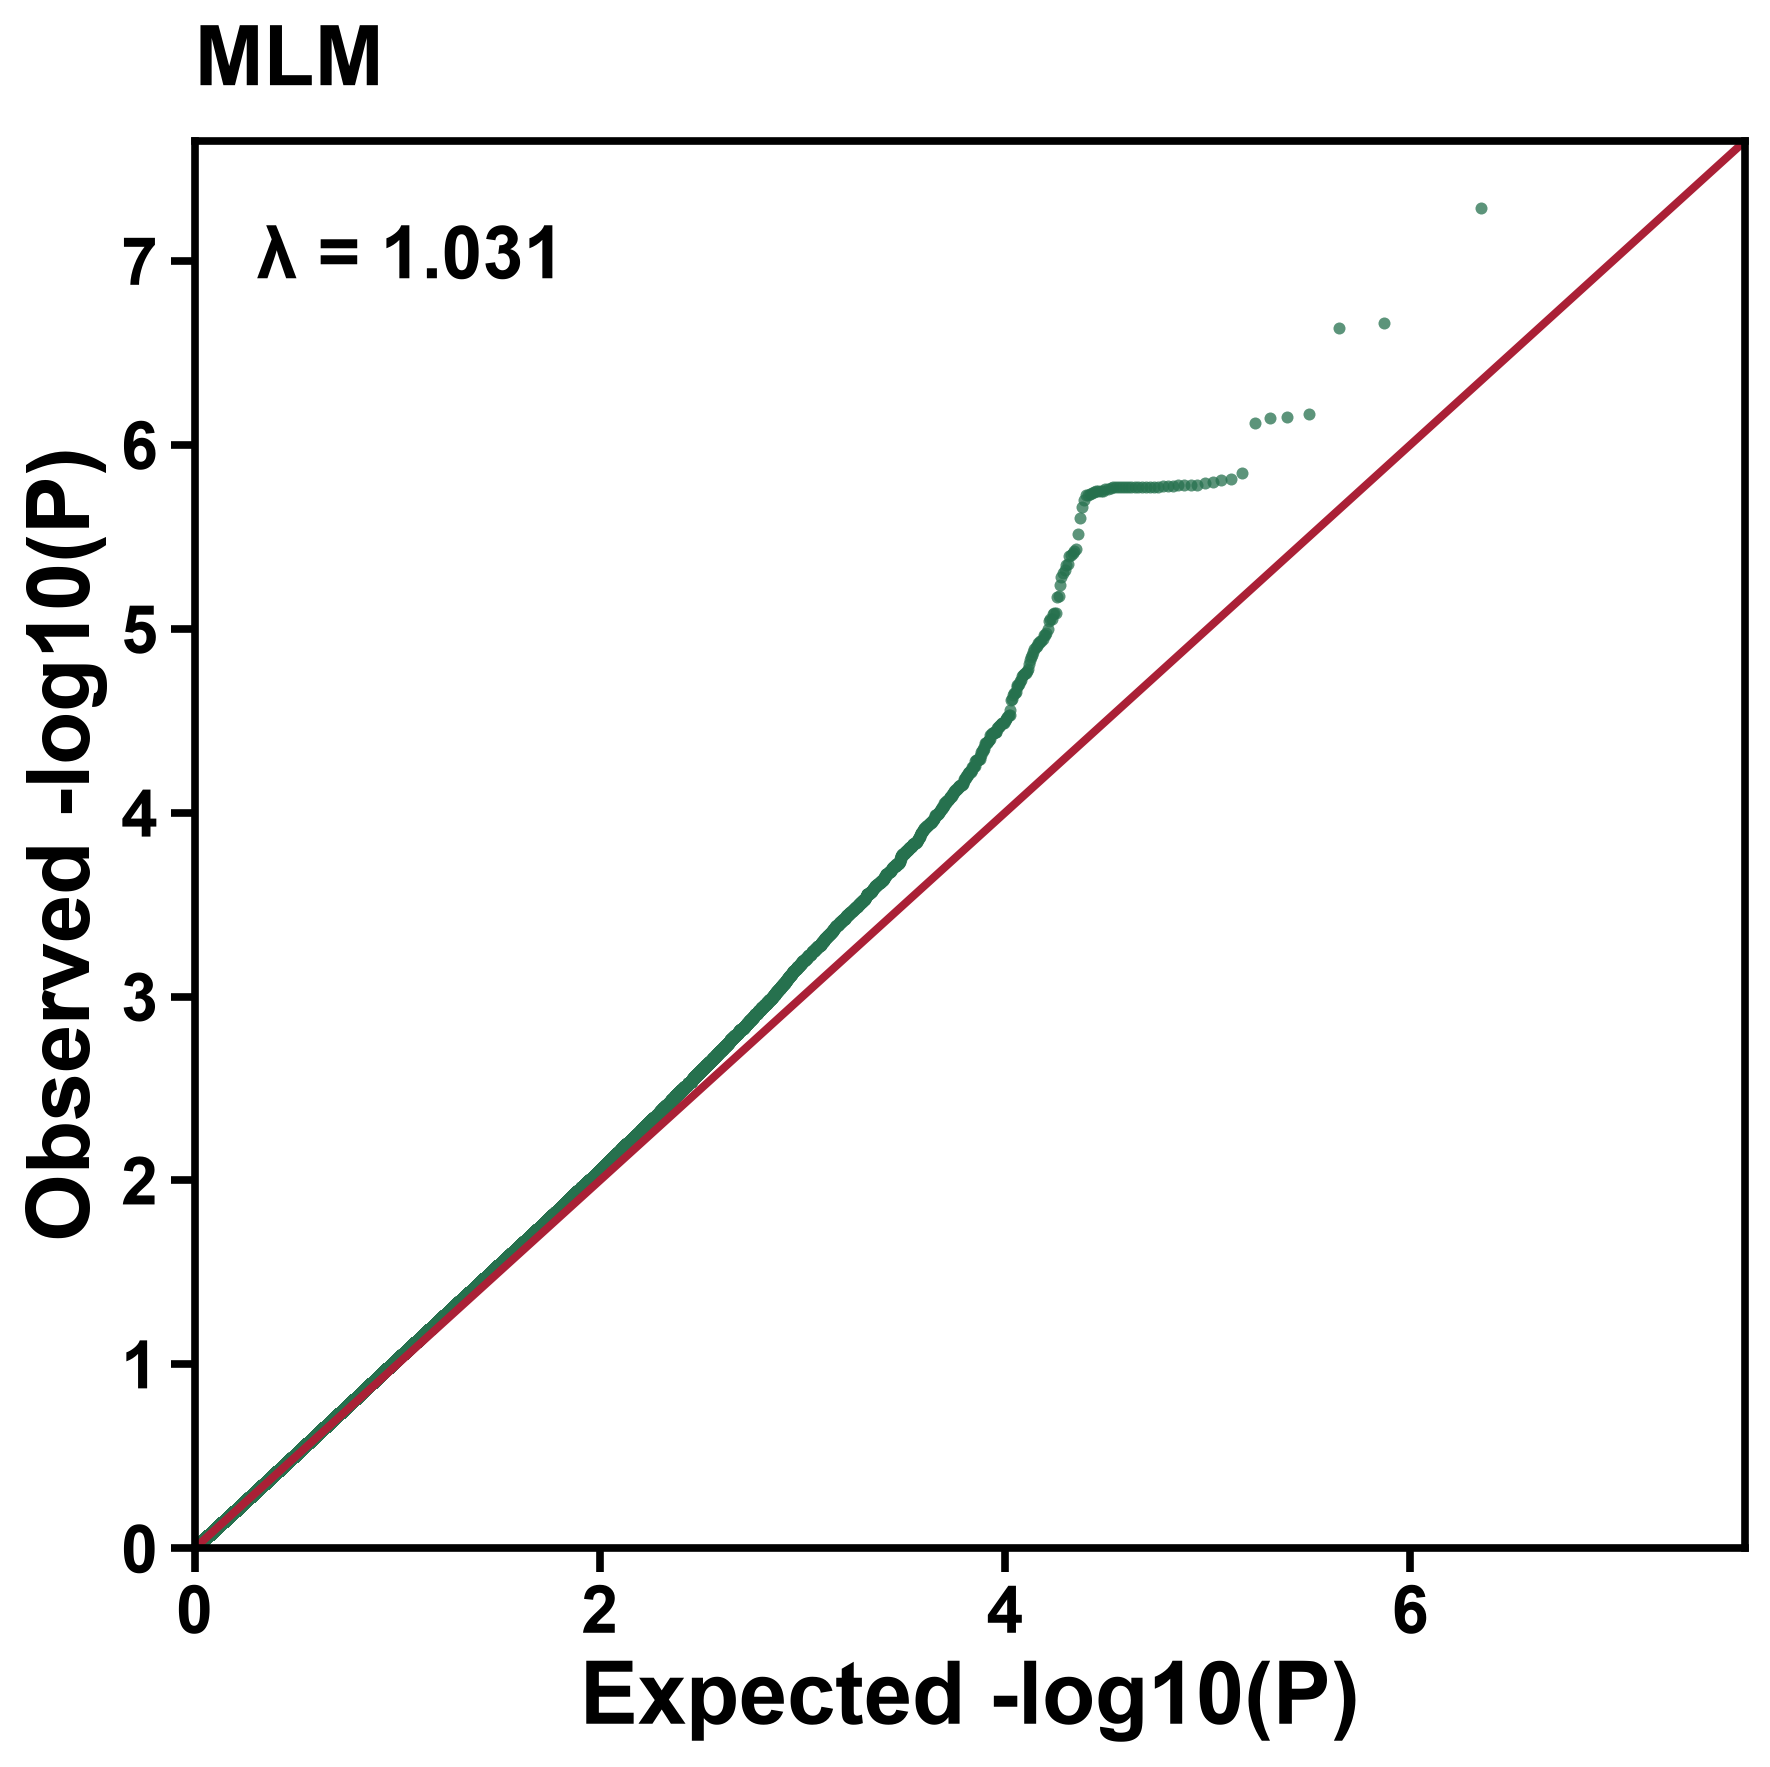
λ = 1.031;Genome-wide threshold P ≤ 4.5e-08。
MLM converged with the GRM variance component near its lower boundary. This conditional fit does not establish zero trait heritability; interpret it with the family design and robustness checks. V(G)=1e-05;V(e)=4.3028。
Filter association statistics
| Variant | Position (bp) | Effect allele | n | β | P | FDR q | Nearest gene |
|---|---|---|---|---|---|---|---|
| TK1151:6:91279448:T:C | Chr06:91,279,448 | C | 126 | 2.966 | 5.15e-08 | 0.0463 | TkA06G368510 |
| TK1151:2:115973518:A:T | Chr02:115,973,518 | T | 126 | -4.182 | 2.18e-07 | 0.0463 | TkA02G455250 |
| TK1151:8:70383246:A:C | Chr08:70,383,246 | C | 126 | 3.145 | 2.32e-07 | 0.0463 | TkA08G270160 |
| TK1151:4:4042389:T:A | Chr04:4,042,389 | A | 126 | 1.702 | 6.78e-07 | 0.0463 | TkA04G016310 |
| TK1151:7:74767437:C:T | Chr07:74,767,437 | T | 126 | 7.332 | 7.1e-07 | 0.0463 | TkA07G297620 |
| TK1151:2:41556449:A:G | Chr02:41,556,449 | G | 126 | 1.988 | 7.11e-07 | 0.0463 | TkA02G162070 |
| TK1151:7:74767452:G:A | Chr07:74,767,452 | A | 126 | 7.312 | 7.61e-07 | 0.0463 | TkA07G297620 |
| TK1151:2:130028214:A:C | Chr02:130,028,214 | C | 126 | -10.04 | 1.43e-06 | 0.0463 | TkA02G506880 |
| TK1151:2:41555288:C:T | Chr02:41,555,288 | T | 126 | 1.968 | 1.53e-06 | 0.0463 | TkA02G162070 |
| TK1151:5:45231414:C:T | Chr05:45,231,414 | T | 126 | -3.875 | 1.56e-06 | 0.0463 | TkA05G177450 |
| TK1151:1:99932398:G:A | Chr01:99,932,398 | A | 126 | -9.996 | 1.59e-06 | 0.0463 | TkA01G400290 |
| TK1151:1:18040053:C:T | Chr01:18,040,053 | T | 126 | -9.988 | 1.62e-06 | 0.0463 | TkA01G070550 |
| TK1151:3:75945291:A:G | Chr03:75,945,291 | G | 126 | -9.982 | 1.65e-06 | 0.0463 | TkA03G308830 |
| TK1151:3:75945301:A:T | Chr03:75,945,301 | T | 126 | -9.982 | 1.65e-06 | 0.0463 | TkA03G308830 |
| TK1151:5:62735099:C:G | Chr05:62,735,099 | G | 126 | -9.979 | 1.66e-06 | 0.0463 | TkA05G252240 |
| TK1151:7:24731449:C:T | Chr07:24,731,449 | T | 126 | -9.977 | 1.66e-06 | 0.0463 | TkA07G094780 |
| TK1151:1:18040068:C:A | Chr01:18,040,068 | A | 126 | -9.977 | 1.67e-06 | 0.0463 | TkA01G070550 |
| TK1151:1:112651177:T:C | Chr01:112,651,177 | C | 126 | -9.976 | 1.67e-06 | 0.0463 | TkA01G449580 |
| TK1151:4:56548315:C:T | Chr04:56,548,315 | T | 126 | -9.977 | 1.67e-06 | 0.0463 | TkA04G222210 |
| TK1151:1:30661804:C:T | Chr01:30,661,804 | T | 126 | -9.969 | 1.69e-06 | 0.0463 | TkA01G121250 |
| TK1151:1:64093009:A:C | Chr01:64,093,009 | C | 126 | -9.969 | 1.69e-06 | 0.0463 | TkA01G254100 |
| TK1151:2:19562145:G:C | Chr02:19,562,145 | C | 126 | 9.969 | 1.69e-06 | 0.0463 | TkA02G075560 |
| TK1151:2:30564354:A:C | Chr02:30,564,354 | C | 126 | -9.969 | 1.69e-06 | 0.0463 | TkA02G117290 |
| TK1151:2:53377534:G:A | Chr02:53,377,534 | A | 126 | 9.969 | 1.69e-06 | 0.0463 | TkA02G209120 |
| TK1151:3:110564088:A:G | Chr03:110,564,088 | G | 126 | 9.969 | 1.69e-06 | 0.0463 | TkA03G443530 |
Beta is the change in content percentage points per effect allele. Table filters do not alter the genome-wide plot above.
Methods, sources and scope
This is one F1 family. Phenotypes are published mean natural rubber contents; the VCF was generated by this project from CRA009020 reads. Sample correspondence is supported by unique exact read-count matches; consistency with the author’s original bin coding remains unresolved. Results support exploratory within-family association; candidates require independent validation.
Biallelic SNPs on8 chromosomes; nonvarying offspring GT dosage excluded; GT depth ≥5; variant missingness ≤10%; MAF ≥0.05; sample missingness ≤15%; no HWE filtering in the F1 family. GLM uses nonmissing genotypes per variant; MLM handles residual missing calls by its software defaults. Nearest genes indicate proximity; published marker intervals are not full QTL confidence intervals.
Yang et al., 2023Published QTLsMethods & versionsNumerical validationWorkflow & provenanceFurther analysis plan