PUBLISHED MAPPING · F1 FAMILY
Natural rubber content QTLs
Explore published loci, region genes and material phenotypes.
Physical positions · 1 QTL
Dots mark associated bin markers; click a dot to view one locus. The shared 0–100 Mb window is not a chromosome length.
| QTL | Chromosome | Marker interval (bp) | Genetic position (cM) | LOD | PVE (%) |
|---|---|---|---|---|---|
qHRC-C1-3 | ChrA1 | 95,729,695–95,742,485 | 21.16 | 5.71 | 19.44 |
LOD support chart
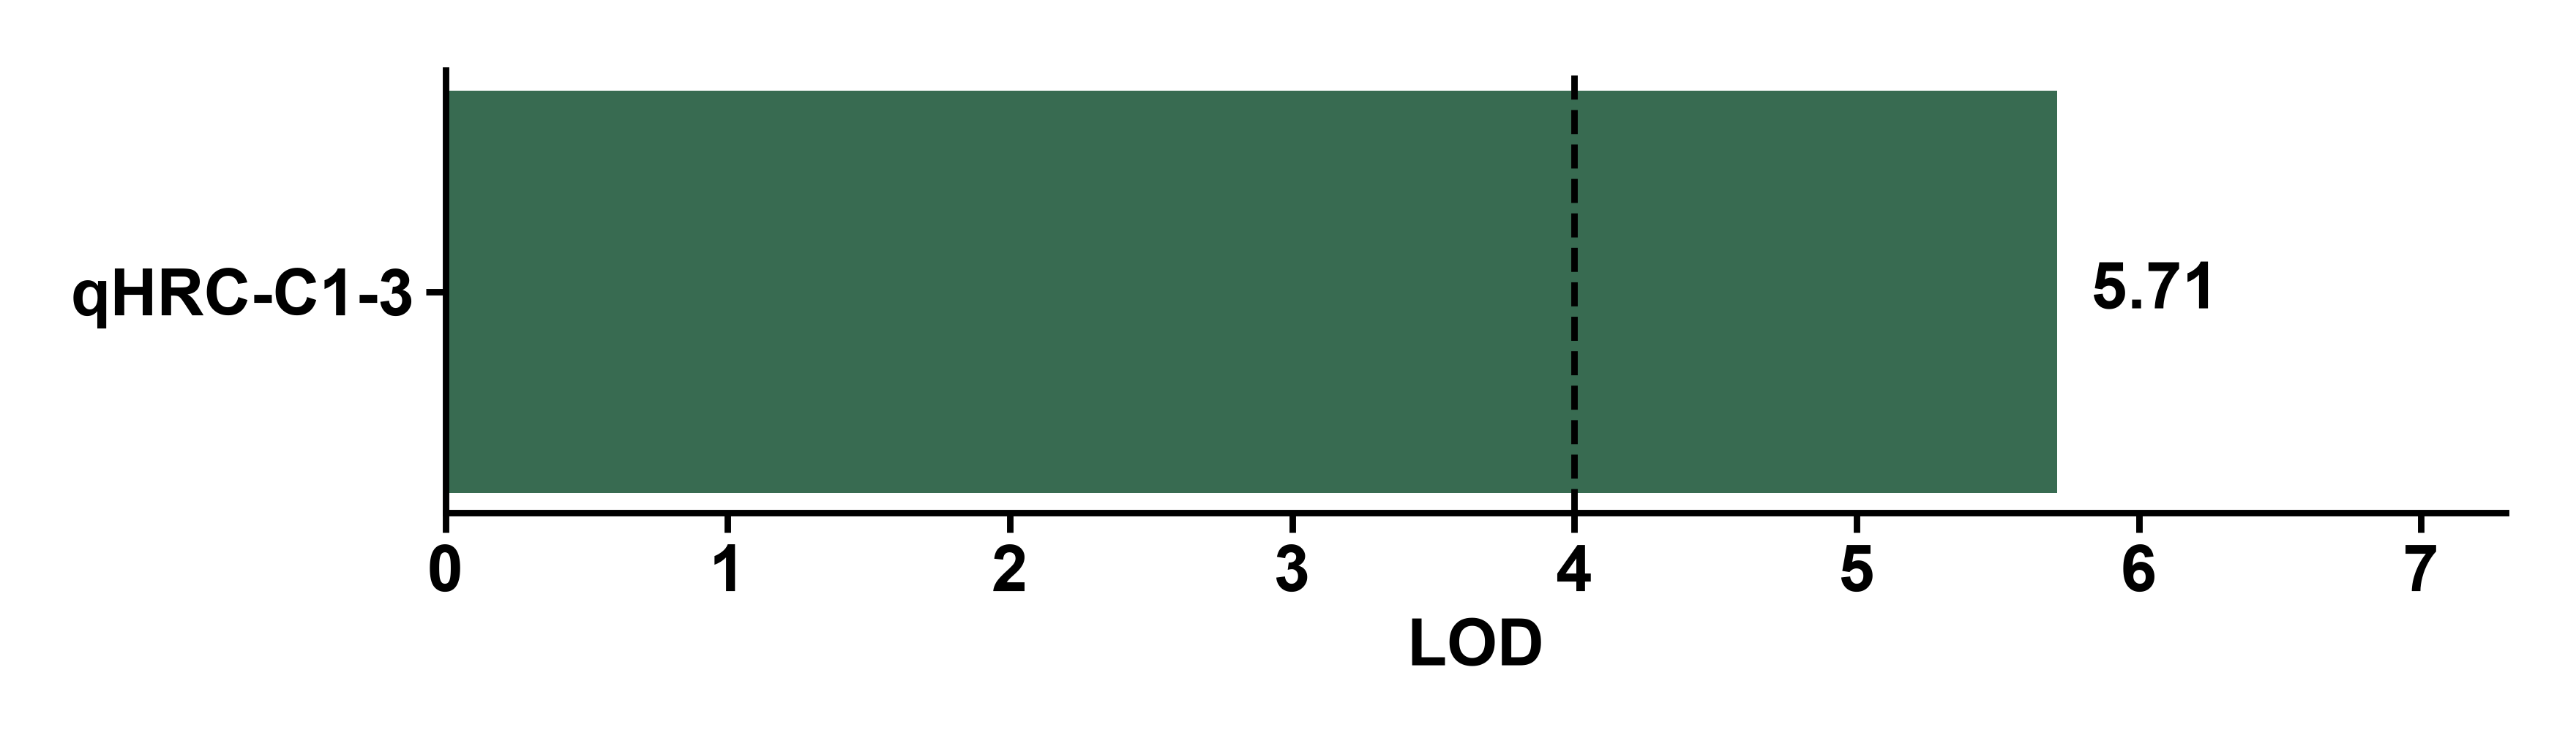
Dashed line: source LOD threshold of 4.0.
Data sources and interpretation
Yang Y, et al. (2023). BMC Genomics 24:13. DOI: 10.1186/s12864-022-09105-3
Loci: Table 3; region genes: supplementary Table S4; phenotypes: supplementary Table S7. Source cells are retained in TSV downloads. Source reference genome: GWHBCHF00000000.
- Marker extents are not QTL confidence intervals and have not been lifted to other website references. Old region-gene IDs are not automatically equated to current models. PVE/LOD are published values; no GWAS was recomputed.
- Table PVE values for the two major ChrA6 QTLs are 24.45% and 23.82% (sum 48.27%), while the abstract states 65.62%. The sum is not an independently estimated joint PVE.
- R01 is 2.92% in the phenotype supplement, whereas parent 166 is 2.09% in the main text. Both values are preserved; paper-to-repository identities remain unresolved.
CRA009020 · GVM000440 · Published mapping table